Script Debugger
- Finding Errors in Scripts
- Compilation errors
- Run-time errors
- Logic errors
- Debugger Settings
- Turning on the Debugger
- The DEBUG()Command
- Loading scripts into the Debugger's Module Window
- Using the Trace into Next Script Command
- Starting the Debugger Automatically
- Debugger Menu Commands
- Go
- Icon
- Hot Key
- Break
- Icon
- Hot Key
- Step
- Icon
- Hot Key
- Step Out
- Icon
- Trace
- Icon
- Hot Key
- Skip
- Icon
- Run to Cursor
- Icon
- Hot Key
- Trace into next script
- Icon
- Set breakpoint
- Icon
- Hot Key
- Remove breakpoint
- Icon
- Hot Key
- Using the Debugger
- Profiling Scripts
- Extended Debugging Information
Description
The Script Debugger allows the programmer to step through an Xbasic script or function and watch as Alpha Anywhere executes each line.
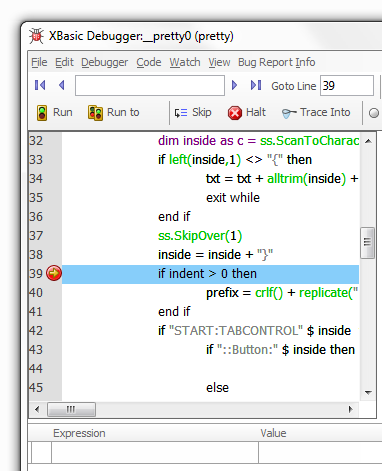
You can selectively debug only portions of your code by placing debug(1) (start debugging) and debug(0) (end debugging) commands around the code of interest. You can set breakpoints and examine the value of variables. The debugger's main window is divided into two areas: the Module window shows the script that is being debugged. The Watch window shows the variables and properties whose values you want to inspect as the script runs.

The left side of the Module window has a column that is reserved for display of icons indicating which line in the script is currently executing and which lines have breakpoints. The current line indicator icon and the Breakpoint indicator icon will appear in this column. The currently selected line will be highlighted in blue. The Watch window at the bottom of the screen allows you to examine the contents of variables, fields and object properties. The Watch window has two columns, one to hold variable expressions and a second to display the result of those expressions. The value column will show an error message in red, such as 'variable "txt" not found' if a variable has no clear value. To use the Watch window, enter an expression whose value you want to monitor in the left column. Alpha Anywhere will evaluate the expression and show the result in the right hand column of the Watch window. The Watch button at the top of the Xbasic Debugger Dialog allows you to manipulate the Watch window in different ways. Clicking Watch > Clear Watches will clear all of the variables and results from the Watch Window. Here you can also use Watch > Save to file and Watch > Load from file to save and load Watch window variables and results. If the variable you are looking at is a string, you can use Watch > Expand all Watches to show you everything in that string on multiple lines. Likewise, if the variable you are looking at is an object, using the Expand all Watches option will show you all of the different properties of that object. Expand all Watches allows you to see these object properties as individual variables, so it is possible to click on a single property within an object and see its value. Collapse all Watches simply reduces the size of an expanded variable row back to its normal size.
Finding Errors in Scripts
As you design and run scripts, there are three types of errors that can occur:
Compilation errors
Usually caused by a typographic error, the absence of a required parameter or statement, or the incorrect usage of a function or method. These errors prevent Alpha Anywhere from successfully compiling the script into machine instructions. Compilation errors are easy to find since Alpha Anywhere detects them before the script is run, can direct you to the line in question, and can briefly describe the problem.
Run-time errors
Occur only when a script is run. These errors are generated when scripts produce bad or illegal values, or try to run an impossible operation. In most cases you should design your scripts with run-time errors in mind. For example, the Disk Full run-time error might occur when you create a new file. Since there is no way to know if the disk is full until you try to create the file, you should write an error handling routine to trap for this possibility and have your script act accordingly. Use the "ON ERROR GOTO" statement to handle run-time errors.
Logic errors
The hardest to find; the only indication of a logic error may be a bad value or an unexpected result. Alpha Anywhere cannot tell you when a logic error is present, so it is up to you to test for and find these problems. To help you in this, Alpha Anywhere provides a debugger which allows you to trace through the logic flow of the script more carefully, tracking the values of variables and object properties. A script (or program) that does not work correctly is said to have a "bug" in it. The act of finding and correcting these problems is what is traditionally called "debugging".
Debugger Settings
The Debugger Settings dialog allows you to set certain debugger options. To display this dialog, select the Debug > Settings command.
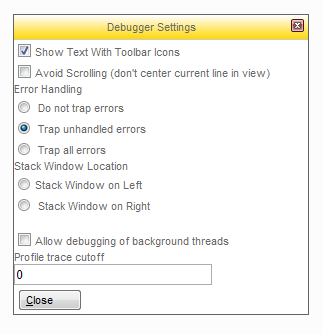
The Preload event scripts option will cause the debugger to load into memory the event scripts for a form when the form is loaded into memory. You can then use the File > Open command to display a script in the Module window. If this option is not selected, the debugger only loads an event script into its memory when the script executes for the first time.
The "Debugger thread priority" options give you control over the execution of background threads. The default option is to interrupt background threads for faster debugging. The "Error Trapping" options specify under which conditions the debugger will alert you if an error occurs in a script.
Do not trap errors - lets Alpha Anywhere (and not the debugger) report errors.
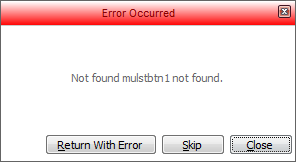
Trap unhandled errors - will display the "Error Trap" window whenever an error occurs for which there is no ON ERROR handler. If there is an ON ERROR handler, it is assumed that the script will handle the error.
Trap all errors - will stop on any error and display the "Error Trap" window (even if there is an ON ERROR handler).
The Script Error Trap window looks like this:
Turning on the Debugger
There are three ways in which you can turn on the Alpha Anywhere script debugger:
Insert the DEBUG() command in the script at the point where you want to start debugging the script. Debug(1) turns on the debugger and Debug(0) turns off the debugger.
Load the script that you want to debug into the debugger's Module window and set a break point. The next time this script is executed, the debugger will automatically be invoked at the break point.
Select the Debug > Trace into next script command from the Debugger's Debug menu. The next script that is invoked will automatically be displayed in the debugger's Module window.
The DEBUG()Command
The following script shows how the DEBUG() command is used. This script is attached to a button on a form. It enters a new record into the table. The debugger will start when code execution reaches the debug(1) statement and will stop when it reaches the debug(0) statement.
debug(1) 'turn on the debugger tbl=t able.current() tbl.enter_begin() tbl.first_name=" Peter" tbl.last_name=" Jones" tbl.enter_end(.T.) debug(0) 'turn off the debugger count=t bl.records_get() ui_msg_box("The table now has: ", str(count,4,0) + " records.")Loading scripts into the Debugger's Module Window
To use this method of invoking the debugger:
Run the debugger by selecting the View > Debugger command from the Alpha Anywhere menu bar. If the debugger has already been launched, then simply activate it by clicking its icon on the task bar.
Select File > Open. The Open a script dialog is displayed.
Depending on the setting of the "Preload event scripts setting" on the Debugger Settings dialog, the script that you want to debug may not be listed in the dialog. If so, close the dialog, and select the Debug > Load event scripts command to load the scripts that are attached to all of the events of the open form and browse windows into memory. Then re-select the File > Open command and select the script that you want to debug. It will now appear in the Module window.
Highlight a line in the script and press F9 to set a breakpoint.
Return to Alpha Anywhere. The next time the script for which you just set a breakpoint is executed, the script debugger will be activated and the script will be displayed in the debugger's Module window.
Using the Trace into Next Script Command
To use this method:
Run the debugger by selecting the View > Debugger command from the Alpha Anywhere menu bar. If the debugger has already been launched, then simply activate it by clicking its icon on the task bar.
Select the Debug > Trace into next script command.
Return to Alpha Anywhere. The next script that is executed will cause the debugger to be activated and the script will be shown in the debugger's Module window.
Starting the Debugger Automatically
To use this method:
Click View > Settings... > Preferences > Script Errors.
Select "Yes" in the Value list box.
Debugger Menu Commands
Go
If the script is stopped, continue execution until the script is finished, or a breakpoint is reached.
Break
Halts execution of the script. This is the equivalent of putting a "Stop" command into the script.
Step
Executes the current line of the script, then pauses. This differs from the "Trace" command in that it will not step into functions and scripts that are called by the current line.
Step Out
If you are inside of a function call and want to return back to the function that called it, step out will take you there.
Trace
Executes the current line of the script, then pauses. This differs from the "Step" command in that if the current line calls a function, or another script, the debugger will trace into the called function or script.
Skip
Skips over current line without executing it. The script will resume execution on the subsequent line.
Run to Cursor
Runs the script until the highlighted line is reached. This operates like a one-time breakpoint executing the script until the selected line is reached.
Icon

Hot Key
F4
Trace into next script
Trap the next script. The next time any script is played, it will automatically be displayed in the debugger.
Icon

Set breakpoint
Set a breakpoint on the currently selected line. Every time the selected line is reached, the debugger will stop.
Icon

Hot Key
F9
Remove breakpoint
Clear a breakpoint from the currently selected line. Removes breakpoint from the selected line
Using the Debugger
Using the debugger is easy.
Insert the debug(1) command at the top of your script, but within code that will be executed. If you placed the debug(1) above the function statement, it would not be executed.
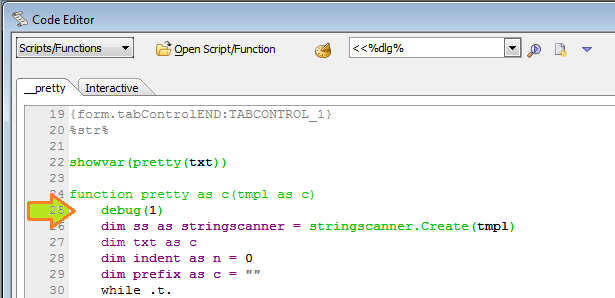
Run the function, script, or form in the normal fashion (for example, by clicking the lightning bolt at the left of the control panel). The objective is to cause this piece of code to run. The current line indicator will stop on the first executable line after the debug(1) statement.

Scroll down and double-click where you would like the debugger to stop. You can set as many breakpoints as you want.
Click the 'go' button to start execution of the script. Code execution will stop at the breakpoint.
Enter the name of any variable or enter any expression you want to evaluate in the Expression column at the bottom of the screen. Press Tab and the Value column will display its current value. Press the step button to step through lines of the script to see which branches it follows.
Remove any unneeded breakpoints by double clicking on them. Either let the script run to completion or press 'break' to stop it immediately.
Profiling Scripts
Another useful technique for finding errors in a script is to use the PROFILER_BEGIN() and PROFILER_END() commands in your Xbasic script. Insert PROFILER_BEGIN()at the start of a section of Xbasic code and PROFILER_END()at the end of a section. Then run the code and open the Trace window. Alpha Anywhere will show you each line of Xbasic that was executed.
Extended Debugging Information
You can cause extended debugging information to be written to the standard Windows event log when an Xbasic script error occurs. Refer to A5.SYSTEM_MODE_SET(). To view the Windows event log, click Start on the Windows desktop, go to the Windows Control Panel > Administrative Tools > Event Viewer.